ONFIX — Smart Cities Engine for Urban Intelligence
Optimize traffic, enhance safety, and improve urban planning with real-time analytics. Schedule an ONFIX pilot today.
Multi-source Ingestion
- Connects to CCTV, ANPR, loop counters, bus AVL, parking sensors, weather, air-quality nodes.
- Normalizes feeds into standardized schemas (vehicle_count, pedestrian_density, etc.).
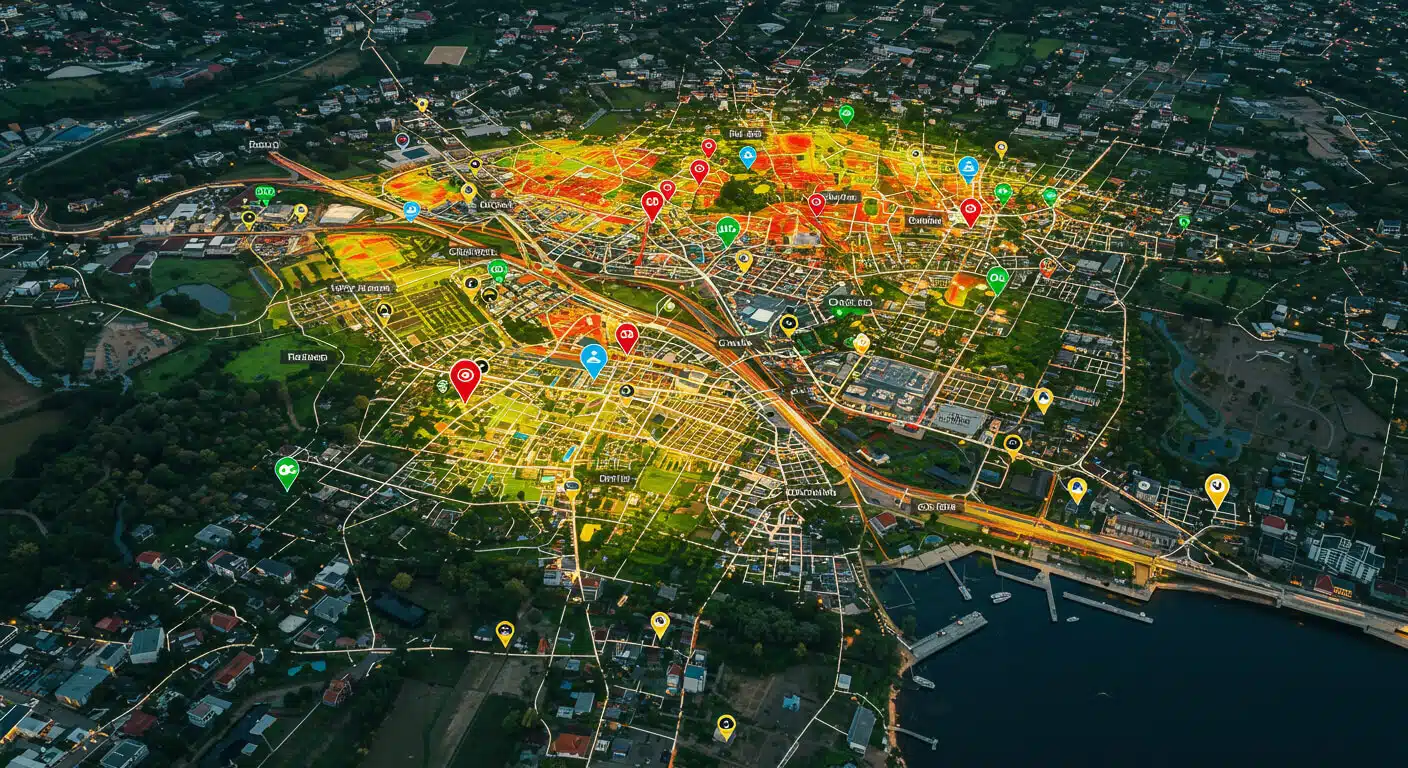
Real-time Dashboards
- Live maps with traffic, pedestrian flow, incidents, air quality layers.
- Playbook view for operations: incident timeline, response suggestions.
- APIs for municipal dashboards and third-party apps.
Predictive Analytics
- Short-term forecasting (0–60 min) for congestion and crowd volumes.
- What-if simulations for closures, events, or policy changes.
- Anomaly detection for flash crowds, protests, or pile-ups.
Automated Alerts
- Rule engine triggers multi-channel alerts (SMS, email, webhook).
- Automated VMS updates and traffic-light timing suggestions.
Environmental Modules
- Correlate traffic with NO₂/PM2.5 for congestion pricing or rerouting.
- Idle-time reduction and EV-charging demand forecasting.
Citizen-facing APIs
- Public feeds for ETA widgets, congestion heatmaps.
- Privacy-first: aggregated data only in public endpoints.

Traffic Management
Reduce congestion with real-time rerouting and predictive congestion modeling for municipal traffic operations.
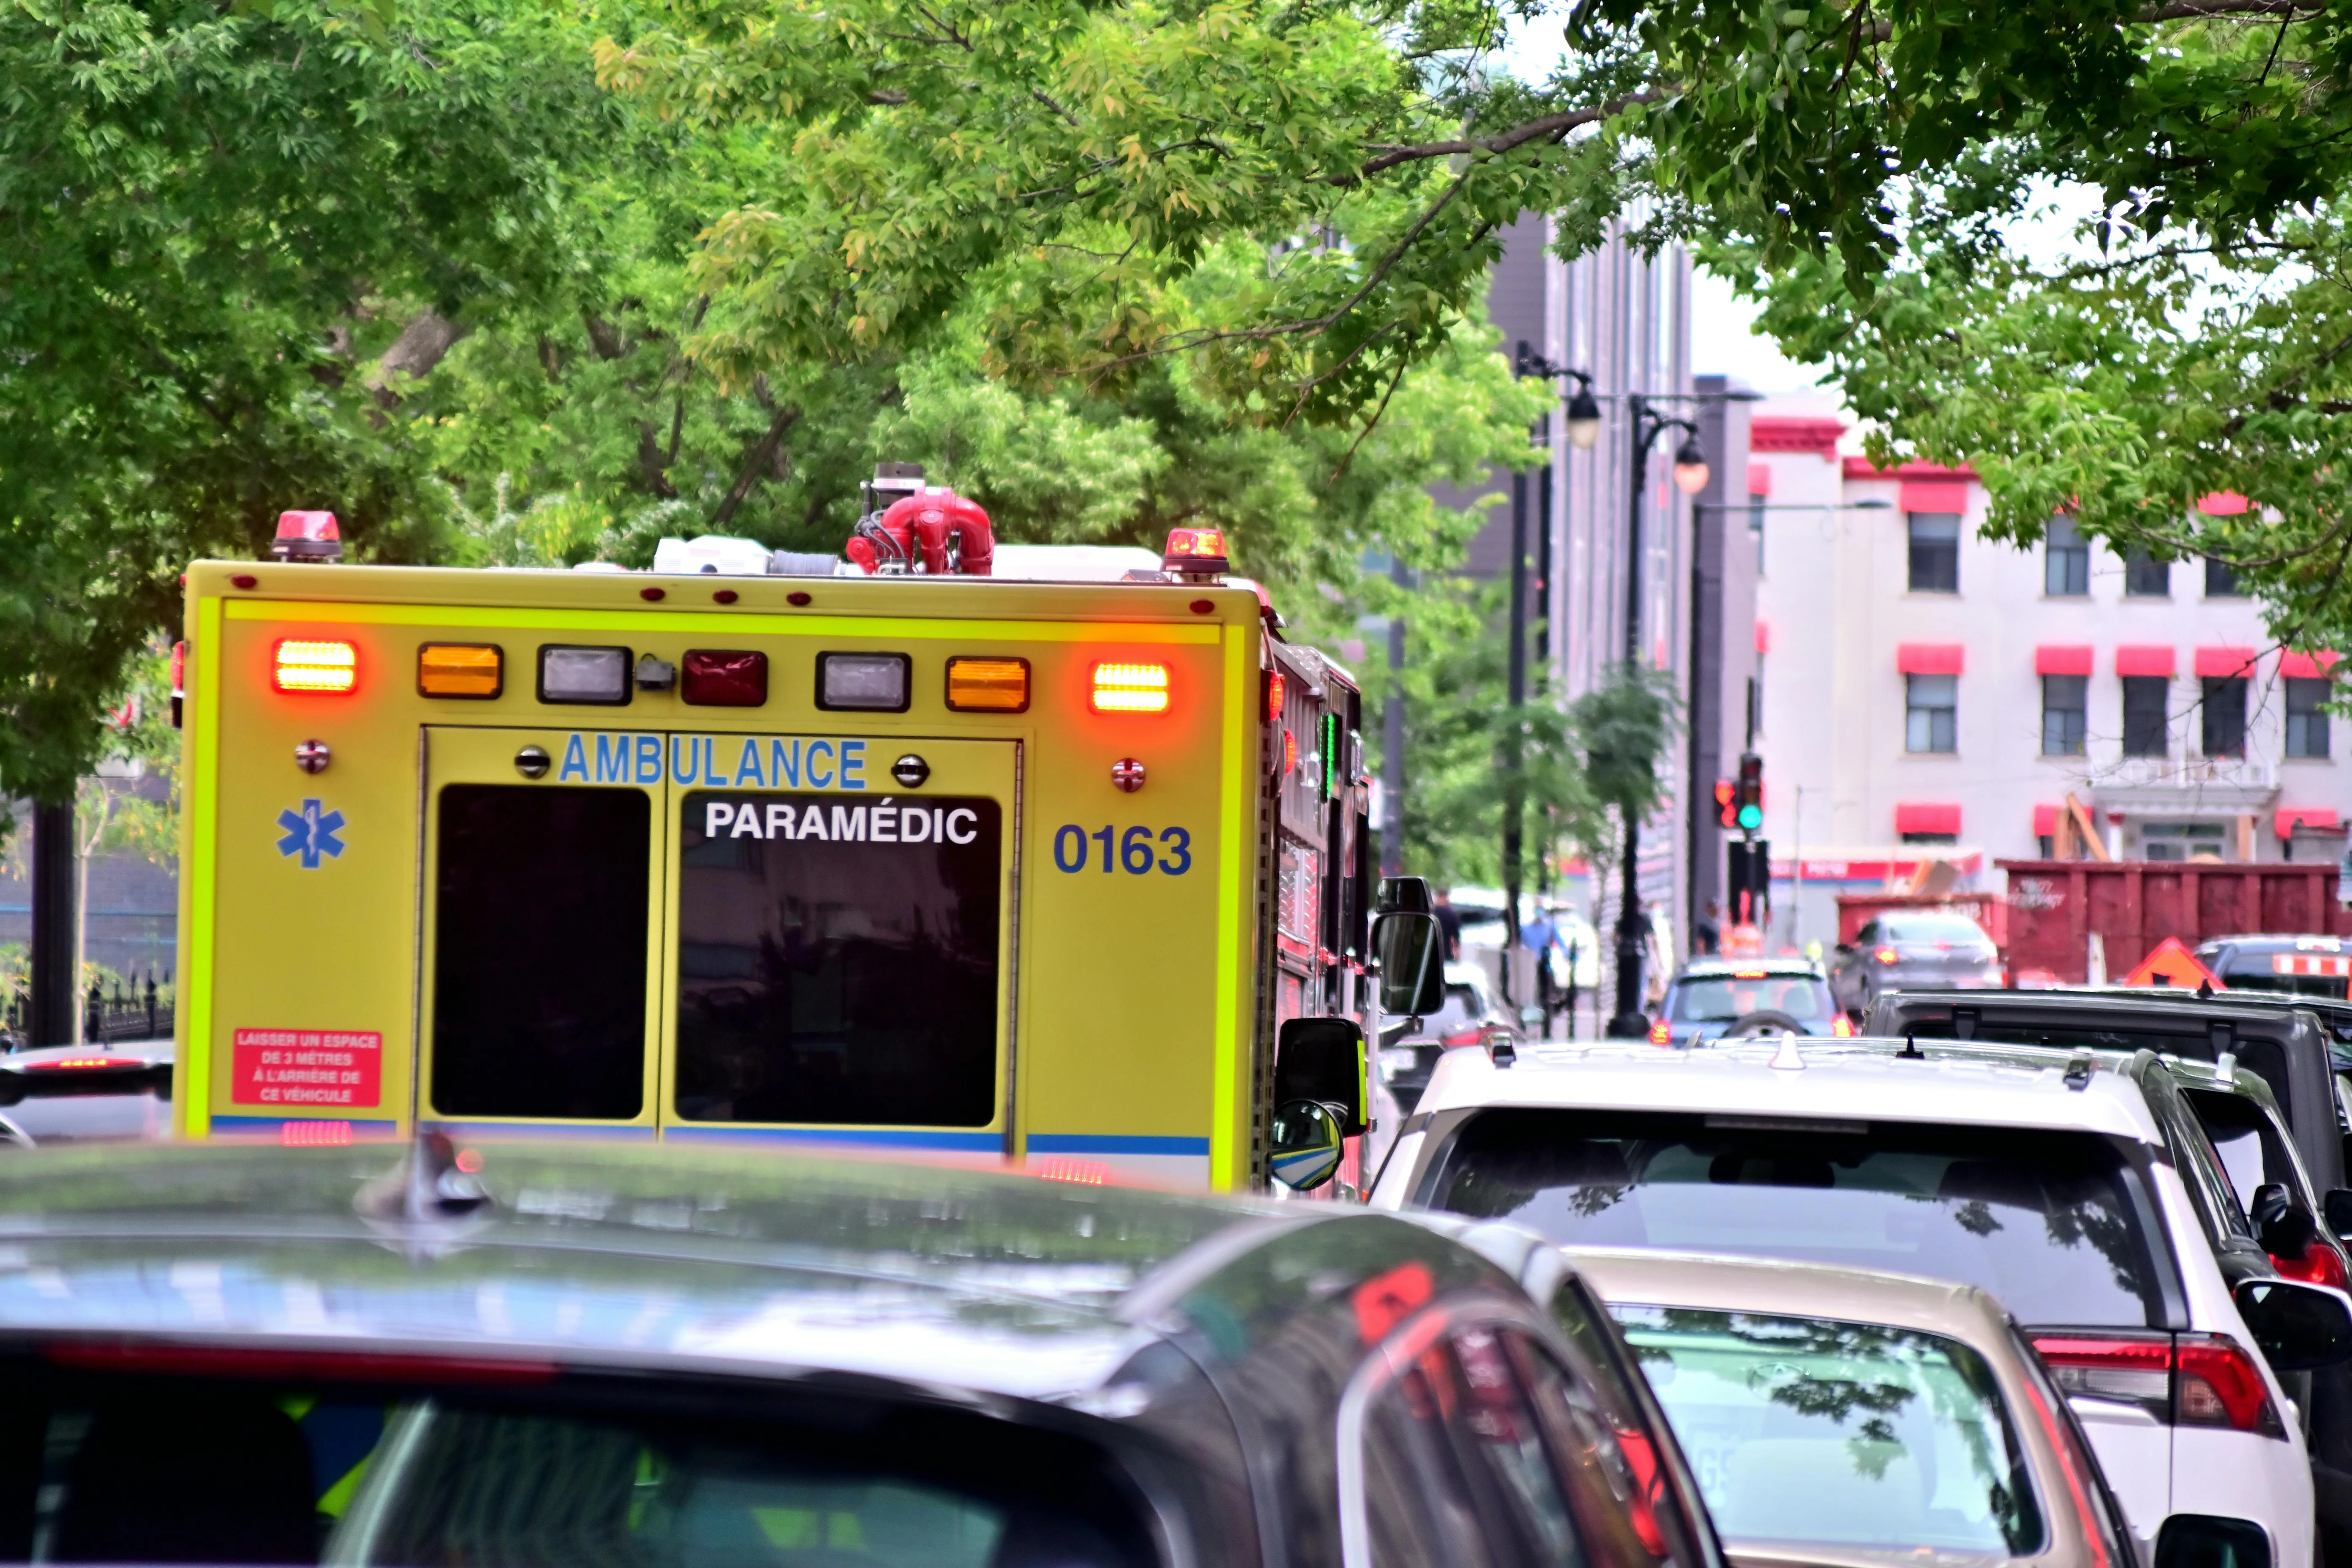
Emergency Response
Speed up incident response with automated alerts and playbook-driven dispatch recommendations.

Environmental Monitoring
Track NO₂, PM2.5, and CO₂ levels to inform congestion pricing and rerouting for better air quality.
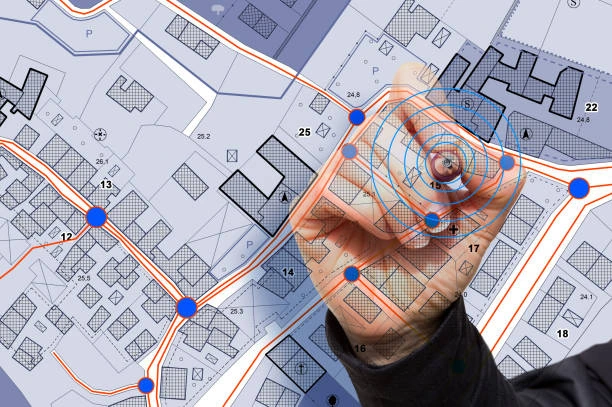
Urban Planning
Use long-term heatmaps and OD matrices to prioritize infrastructure investments like bike lanes or transit hubs.
Public Transparency
Provide commuters with ETA widgets and congestion heatmaps via citizen-facing APIs and apps.
Edge + Cloud Hybrid
- Edge nodes process high-throughput camera feeds (vehicle classification, crowd counts) to reduce bandwidth and preserve privacy.
- Aggregated events stream to the cloud via secure Kafka pipelines for analytics and forecasting.
Modeling Stack
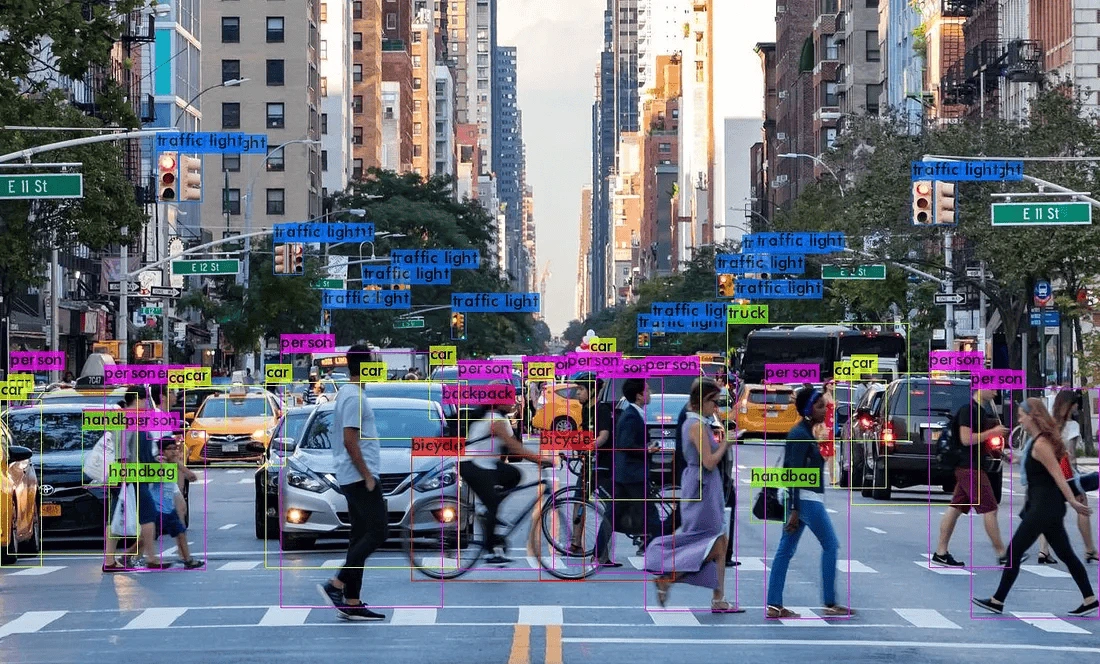
- Ensemble ML models for vehicle type classification (car, truck, bus, boda) and pedestrian flow signatures.
- ARIMA + LSTM hybrid models for short-horizon congestion and crowd predictions.
Integration Layer
- RESTful APIs and WebSocket feeds for live event push to municipal control rooms and GIS stacks.
- Out-of-the-box connectors for PSIM, SCADA, and transport management systems.
Security & Resilience
- TLS, mutual-auth, role-based access, and encrypted data-at-rest.
- Active failover and regional redundancy for critical services.
Traffic & Flow
- Vehicles per lane per minute
- Average vehicle speed (km/h) by segment
- Vehicle composition (%) – cars, buses, boda, trucks
- Congestion Index (0–100) and queue length
Pedestrian & Crowd
- People per square meter (density)
- Origin-destination flows (OD matrices)
- Dwell rate near key nodes (stations, markets)
Environmental
- PM2.5, NO₂, CO₂ levels correlated with traffic intensity
- Idle-time emissions estimates
Operational
- Incident detection time & response time (MTTD/MTTR)
- Predicted vs actual throughput improvements after interventions
Discovery & KPI Workshop
1–2 weeks
Stakeholder alignment, geo-scope, legal clearance, and define success metrics (e.g., reduce corridor congestion by 15%).
Pilot
6–8 weeks
Deploy 3–6 sensor zones (cameras + environmental nodes), configure edge nodes, connect to central dashboard, and validate model accuracy.
Operate & Optimize
8–12 weeks
Expand sensor footprint, integrate AVL/transport telemetry, tune forecasting models, and implement control-room playbooks.
Scale & Automate
Ongoing
City-wide rollout, schedule automation (VMS updates), policy dashboards, SLA-backed support, and model retraining.
Urban Starter Pilot
3 zones, 8-week deployment, dashboard access, 2 API integrations, training.
City Pilot
10–30 zones, ensemble predictive modeling, emergency dispatch integration, monthly performance reviews.
Enterprise / National
Full rollouts, policy simulation modules, dedicated SRE, and integration with national traffic management centers.
Objective
Improve shuttle utilization and reduce wait times during peak office hours at City’s commercial district.
Approach
Integrated shuttle AVL feeds, pedestrian counters at three hubs, and camera-based boarding counts. Short-term forecasts recommended dynamic dispatch intervals and fare incentives.
Outcome
Shuttle wait times reduced by 28% in peak windows; ride occupancy improved by 18%; operations reported fuel savings and predictable scheduling. Justified two additional pick-up bays.